Cadbiom GUI
This guide can help you start working with the Cadbiom GUI.
Overview
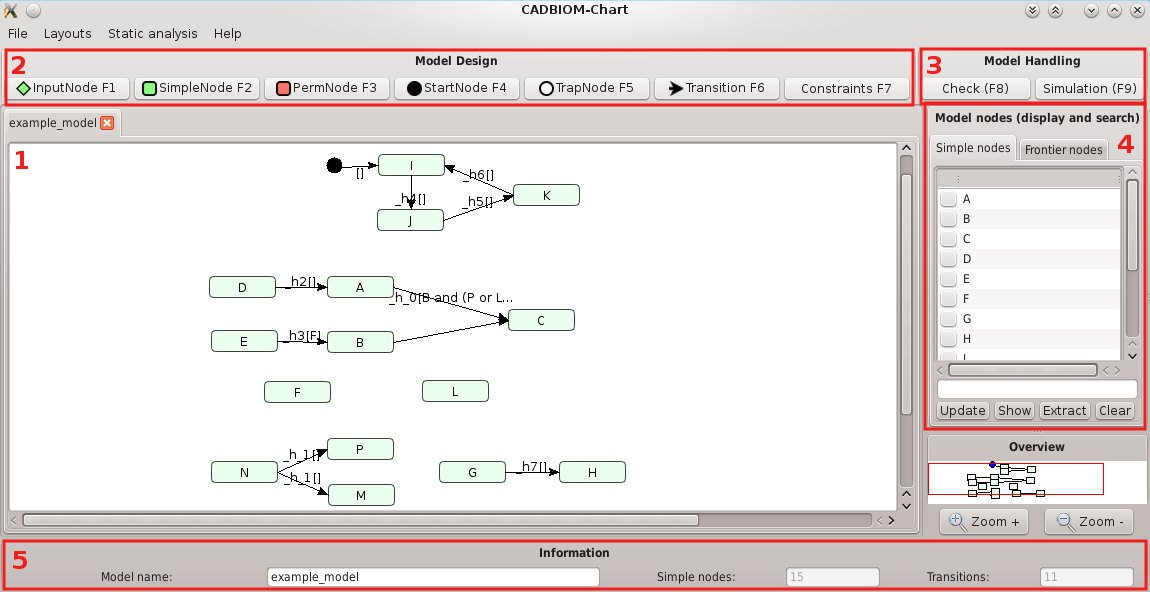
Overview of the Cadbiom Graphical User Interface. (1): Graph editor and its tabs; (2): Toolbar to design models; (3): Search properties and conduct discrete time simulations; (4): Explore nodes of the model (search/show/extract); (5): Show data about the item that is currently selected (model/node/transition).
Loading files
Currently, the following types of files are supported:
- Cadbiom file format (.bcx) (see Models),
- Import BioPAX format from a RDF triplestore (see Creation of a Cadbiom model from a BioPAX endpoint),
- PID file format (.xml),
- Cadlang file format (.cl).
The models can be exported to the following formats:
- Cadbiom file format (.bcx)
- Cadlang file format (.cl)
- Image (.png)
Exploring the models
The "Static analysis/Model information" menu provides detailed information on the model and
its entities; for example, their cellular location, the number of boundaries,
the number of isolated places, etc.
The widget at the bottom of the screen (5) displays according to the selected item:
- global data on the loaded model (model name, number of entities, number of transitions)
- the details of the nodes (names) and transitions (names, clock, condition) selected;
- view the nodes involved in the condition of the selected transition.
The metadata of the element can be consulted in JSON format by clicking on the button "Metadata".
Example of information showed for a transition.
Editing the models
The "Model nodes (display and search)" widget (4) allows to:
- search, filter and display nodes based on their names (a regular expression of type PERL can be used);
- extract a complete sub-model containing the selected nodes and transitions as well as the nodes involved in the conditions of these transitions;
- deselect the nodes.
Copy/paste the nodes is allowed at any time by right clicking in the graph editor, within the current model or to other open models;
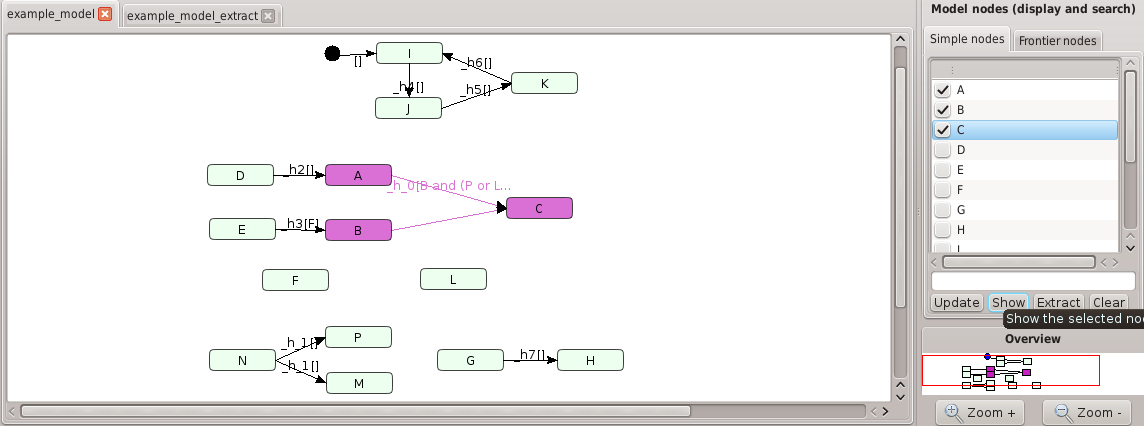
Example of nodes selected and then highlighted on the graph editor.
Design of models
The top toolbar (2) provides easy access to the types of objects that can be created in a Cadbiom model:
- SimpleNode: add a new simple node (most nodes of a model);
- PermNode: add a permanent node (always activated node);
- StartNode: add a start node (without incoming transition, used to unlock cycles (Strongly Connected Components));
- TrapNode: add a trap node (without outgoing transition);
- Transition: add a transition. Draw an arrow between a node and another.
Model checking/property search
The "Check" (3) button opens the checker window.
The checker is aimed to find answers to some queries. It is oriented to signal propagation problems.
Two type of properties can be searched:
- reachability: the property P will happen
- non reachability: P will never happen (¬P)
A property is written as a sequence of place names, linked together by logical operators (and, or, not); it is always checked on a finite horizon (number of steps).
An answer to a query, also called a solution, is a set of boundaries that must be activated to satisfy the property during a scenario. Places that are not in the solution are unactivated at initialization.
Most of time, a solution contains essential places but also noisy places. These places correspond to trajectory fragments without relation with the property. Minimal Activation Conditions (MAC) focus on necessary and sufficient places. Indeed, a MAC is a solution such that no subset of places can lead to the satisfiability of the property.
Generally speaking, obtaining solutions implies obtaining MACs.
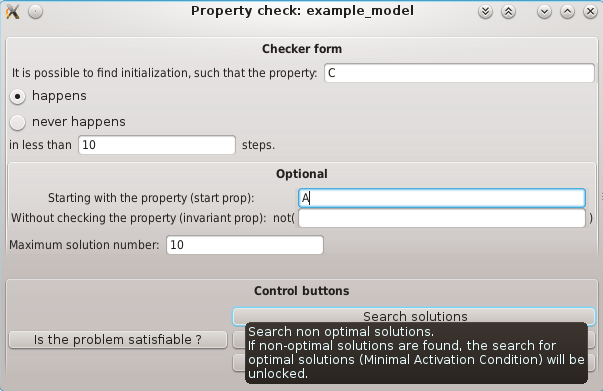
Example of the checker window; Property C is searched with the place A as a start property. This place is not a boundary so we artificially activate it that way.

Example of the solutions window; Each line is a set of boundaries that satisfy the searched property. Each solution can be simulated on the graph editor.
Simulation of trajectories
Discrete time simulation can be performed on the model.
The simulation window can be reached from the main GUI via the "Simulation" button (3),
and from a similar button in the solutions window that is displayed after the property search.
The first way reloads previously saved results, while the second applies to a chosen solution.
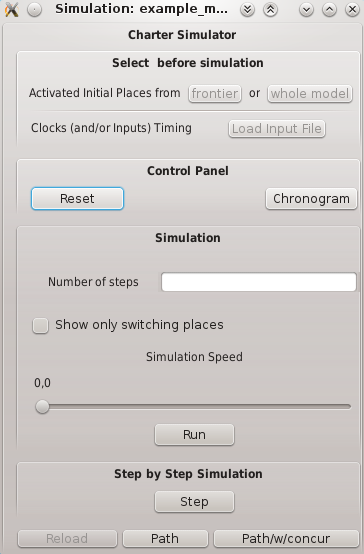
The simulation window is mainly composed of a "step" button allowing to synchronize the graph editor
with a step of the considered solution.
By clicking on "step" in an iterative way you visualize the trajectory taken
by the software to satisfy the desired property.
Example of the checker window; Property C is searched with the place A as a start property. This place is not a boundary so we artificially activate it that way.
Example of simulation step by step on the graph editor.
Keyboard shortcuts
F1: Add InputNodeF2: Add SimpleNodeF3: Add PermNodeF4: Add StartNodeF5: Add TrapNodeF6: TransitionF7: View and edit model constraintsF8: Model checking and property searchF9: SimulationCtrl+O: Open a Cadbiom model fileCtrl+N: Create a new modelCtrl+W: Close the current tabCtrl+Q: Quit CadbiomEscape: Close a subwindow